 P4 Software
/
logisticaHQ-en
P4 Software
/
logisticaHQ-en
A widget is one report: a query that reads your data, and one or more ways to show its rows (a chart, a grid, tiles, a single number, a gauge). Widgets are the building blocks of dashboards: a dashboard is a board of widgets, each in its own panel. The same widget can sit on several Dashboards.
Learn by example: the Examples button above the SQL editor loads any of 59 complete widgets, the query and its presentations together, and Undo brings back what was there. Every example is explained on Widget examples.
Open Setup > Reporting > Widgets. Only office Users can create and change widgets.
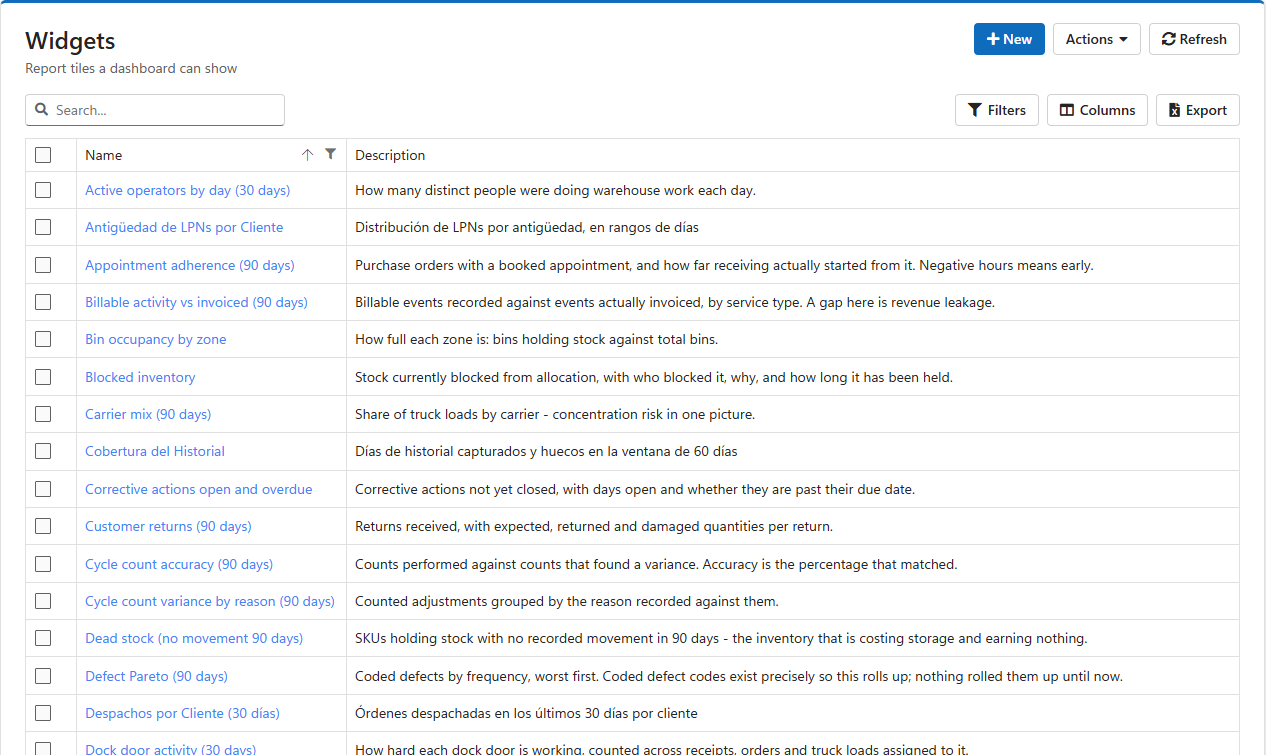
Each row is one widget, with its Name, Description and Created date. Double-click a row to open it.
| Button | What it does |
|---|---|
| New | Asks for a name and a description, creates the widget and opens it. |
| Actions > Refresh | Reads the list again. |
| Actions > Delete | Removes the ticked widgets after you confirm. A widget still placed on a dashboard leaves an empty panel there. |
| Actions > Export | Downloads the ticked widgets as a file, query and presentations included, to copy them to another LogisticaHQ company. |
| Actions > Import | Loads widgets from an exported file. |
To start from a complete set of ready-made widgets and a Warehouse performance dashboard instead, use Seed default reports on the Dashboards list.
The widget screen has a General tab, then one tab per presentation, then a + to add a presentation. Update saves the widget, the query and every presentation together; Refresh reads it again and drops unsaved changes.
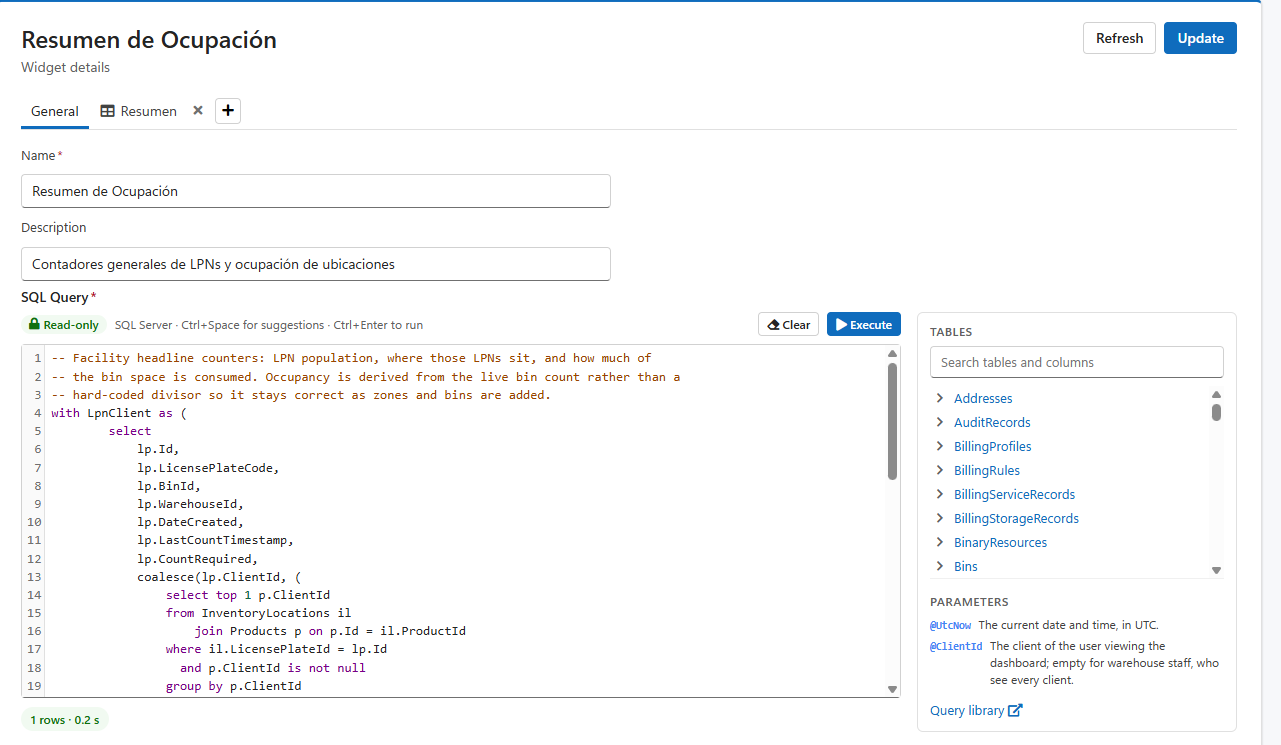
| Field | What it is |
|---|---|
| Name (required) | The widget's name, as the dashboard designer lists it. |
| Description | What the widget shows. |
| SQL Query (required) | The query whose rows the presentations show. |
The query is written in LogisticaHQ's SQL editor, the same one as the Query builder and Scheduled reports: it can only read (a single SELECT, run on a read-only login, never passwords or API keys), colours SQL as you type, suggests tables after FROM and columns in the SELECT list (Ctrl+Space), and lists every table and column on the right. Click a name there to insert it at the cursor.
Execute (or Ctrl+Enter) runs the query and shows the rows under the editor in a Result card, with its own search, filters, columns and Excel export. The × on the card closes it. Look at the result before you set up a presentation: the presentations refer to its column names.
| Write in the query | Replaced with, when a dashboard shows the widget |
|---|---|
@ClientId | The client of the person viewing the dashboard. It is empty for Warehouse staff, who see every client, so filter with (@ClientId IS NULL OR p.ClientId = @ClientId) and one widget serves both. |
@UtcNow | The current date and time, in UTC. |
@{Label} | A filter: a value typed per dashboard panel, in the panel's options. @{Warehouse} is a text box, @{Days:number} a number box, @{From:date} a date picker; the part before the colon is the label people see. |
A filter's value is placed in the query as typed, so put text filters in quotes: WHERE w.WarehouseCode = '@{Warehouse}'; numbers and dates go without: WHERE DATEDIFF(day, pt.ShippedDate, GETDATE()) <= @{Days:number}. With the same widget on two panels, each panel keeps its own values, so one widget can show Warehouse 1001 on one panel and 1002 on another.
A presentation is one way of showing the query's rows. A widget can have several, for example a chart and a grid of the same numbers; each dashboard panel picks the one it shows. Click + and choose the kind:
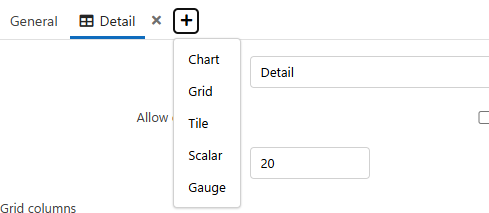
Each presentation gets a tab. Its arrows move it left or right among the tabs, and its × removes it. Every presentation has a Name (required), which is what the dashboard designer offers when you pick a presentation for a panel.
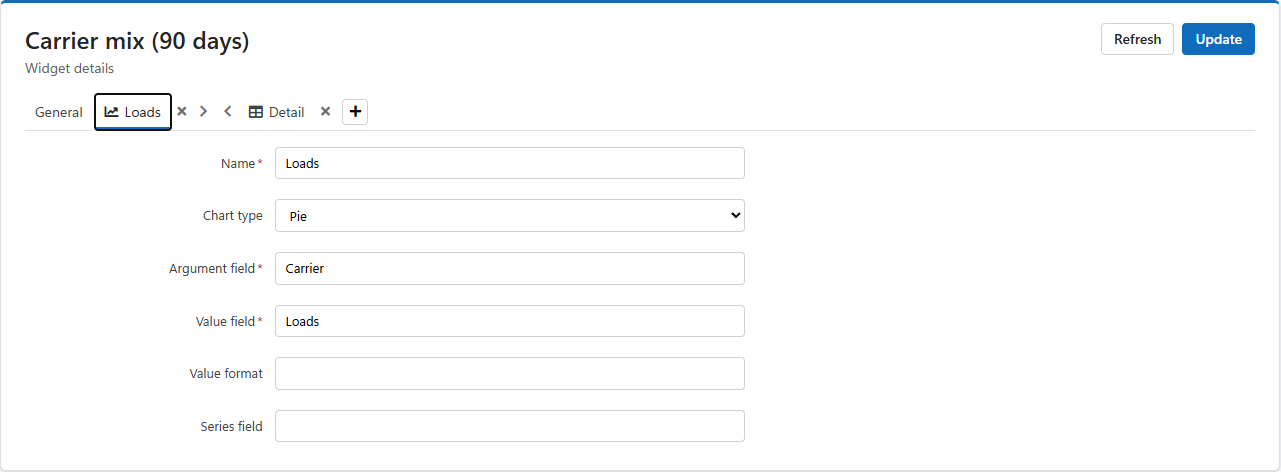
| Field | What it is |
|---|---|
| Chart type | Area, Bar (horizontal), Column (vertical), Line or Pie. |
| Argument field (required) | The column along the axis: dates, SKUs, operators. Type the column name exactly as the result shows it. |
| Value field (required) | The column that gives each point or slice its size. |
| Value format (Pie only) | How slice values are written, for example n0 for whole numbers or p1 for a percentage with one decimal. |
| Series field | Optional. A column that splits the chart into one line or bar colour per value, for example one line per client. |
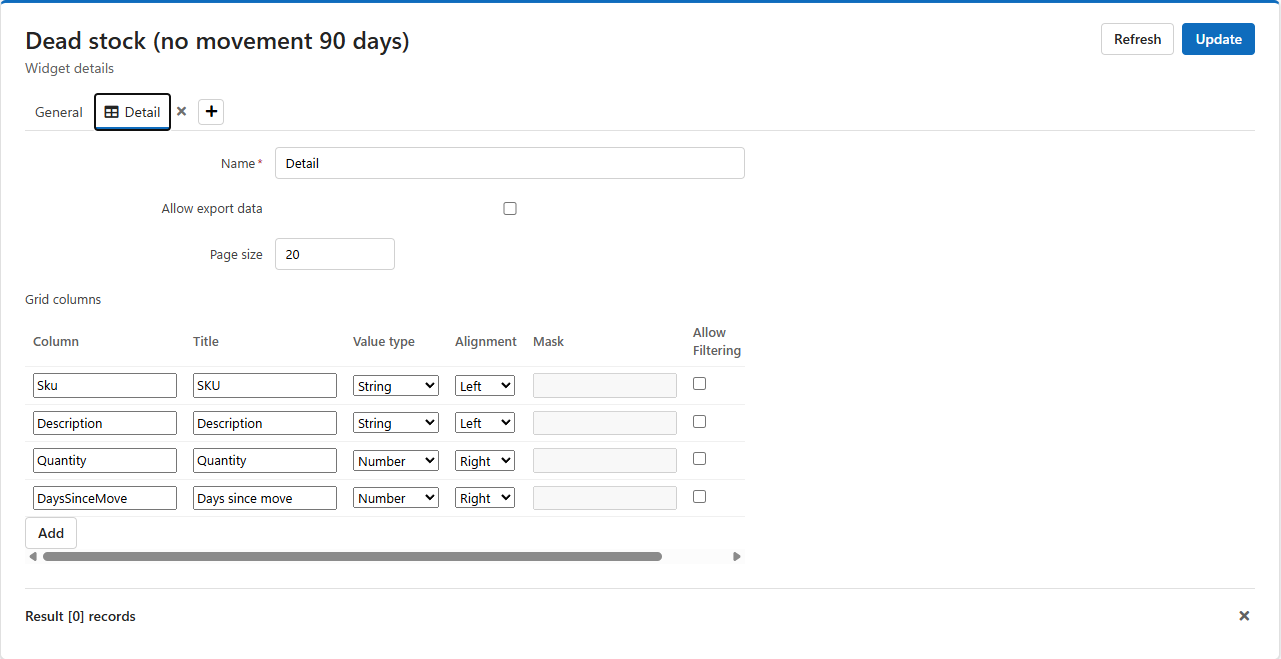
| Field | What it is |
|---|---|
| Allow export data | Gives the grid on the dashboard its toolbar: search, filters, column chooser and Export to Excel. Without it the grid shows the rows only. |
| Page size | How many rows show per page; 20 when left empty. |
| Grid columns | The columns the grid shows, in order. Add adds one; the arrows move a column up or down; × removes it. List every column you want people to see. |
Each column has:
| Field | What it is |
|---|---|
| Column | The query column it shows. |
| Title | The heading people see. |
| Value type | Number, Currency, Percentage, String, Date, DateTime, Boolean or Link. It decides how values are written and sorted. |
| Alignment | Left, Center or Right. |
| Mask (Link only) | The screen the value opens, with @{Column} wherever a value of the row goes, for example pickTicketDetails/@{Id} to open the order whose Id is in the row's Id column. Write only the screen's path; LogisticaHQ adds the rest of the address. |
| Allow Filtering | Shows a filter for the column. |
Tiles show each row of the query as a coloured card, which suits a short list such as one card per Warehouse or per zone.
| Field | What it is |
|---|---|
| Background Color Column | Optional. A query column holding a colour (for example #2e7d32) that colours each tile by its own row, so the query can make late orders red and on-time ones green. |
| Tile Width, Tile Height | The size of each tile, in pixels. |
| Grid columns | The lines on each tile, with the same Column, Title, Value type and Alignment as a grid, plus Text Color, Background Color and Bold for each line. |
A single number in large type: the value in the first column of the first row. Write the query so it Returns exactly that, for example SELECT COUNT(*) FROM PickTickets WHERE ShippedDate IS NULL. A scalar has only its Name.
A dial or bar showing one value against a scale; like the scalar, it reads the first column of the first row.
| Field | What it is |
|---|---|
| Gauge type | Circular (a dial) or Linear (a bar). |
| Orientation (Linear only) | Horizontal or Vertical. |
| Format | How the value is written. |
| Start value, End value | The two ends of the scale. |
| Tick Interval | The distance between the marks on the scale. |
| Ranges | Coloured bands on the scale, each with a Start value, an End value and a Color, for example red from 0 to 80, amber to 95, green to 100. Add adds a band; × removes one. |
SELECT CAST(pt.ShippedDate AS date) AS [Day],
       COUNT(*) AS [Orders]
FROM PickTickets pt
WHERE pt.ShippedDate >= DATEADD(day, -30, GETDATE())
  AND (@ClientId IS NULL OR pt.ClientId = @ClientId)
GROUP BY CAST(pt.ShippedDate AS date)
ORDER BY [Day]Day and Value field to Orders.| What you see | Why, and what to do |
|---|---|
| The chart is empty on the dashboard | The Argument or Value field does not match a column name of the result exactly. Press Execute and copy the name from the result's heading. |
| A client user sees every client's numbers | The query does not filter on @ClientId. Add (@ClientId IS NULL OR x.ClientId = @ClientId) to its WHERE. |
| Execute says the query was refused | It is not a single read-only SELECT, or reads protected data. The message says which. |
| A filter shows no box on the panel | Its placeholder is misspelt. Write it as @{Label}, @{Label:number} or @{Label:date}, then open the panel's options again. |
Was this page helpful?